IBM has released CLM 6.0.2. As you likely know, CLM includes IBM Rational Quality Manager, IBM Rational Team Concert, and IBM Rational DOORS Next Generation, as well as some other tools for reporting and configuration management.
As always, you can just head to jazz.net to download the latest and greatest. And as always, I like to list the new features all in one page. Warning: The list is massive! Here goes!
Rational DOORS Next Generation
Artifact workflow
Artifact workflow editor
A new workflow editor is available that you can use to create and modify custom workflows for artifacts. A workflow consists of a set of states, a set of actions, and a state transition model. After a workflow is associated with an artifact type, artifacts of that type can move through the various states as part of its lifecycle. For consistency, the workflow editor is similar to the Rational Team Concert and Rational Quality Manager workflow editor.
Sample default workflow
A sample default workflow is available for you to view, use, or customize. This workflow is available for new projects in new installations of Rational DOORS Next Generation. It is not currently available if you upgrade.
Create a new workflow
You can create a new workflow by clicking Add. In the Add Workflow window, you enter a unique workflow ID and name.

Add workflow states
After you specify a workflow name and ID, you can add the workflow states by clicking Add. The workflow state information is displayed in the States section.

Add workflow actions
After the states are defined, you can create the workflow actions by clicking Add. Workflow actions are used to transition to a particular state. Note that when you define the action, you only specify the resulting target state; you do not specify the source state (which is where state transitions apply). You can also define multiple actions that result in the same target state.

State transition model
State transitions provide the link between the source and target states. You can use the state transition model to specify which action can be applied to a particular state to transition it to a different state.

Workflow permissions
By setting permissions on workflow actions, you can control which user roles can move or transition an artifact to a particular state.
Keeping actions and transitions separate provides flexibility for how you define permissions. For example, you can have a permission control each way to get into a particular state by using a single action for every transition to that state. Then, you only have to define the permission once. You can also have different permissions for different ways to get to a given state by using different actions for the different transitions into that state.

Assigning workflows to artifacts
You can now assign a workflow to an artifact type on the Artifact Types tab of the Manage Project Properties page. Artifacts of that type can now transition through the different states of the workflow. When you change the state of an artifact, only the possible and permissible actions for that state are displayed.
Workflow support for process automation of requirements
View and edit an artifact’s workflow state
After you assign a workflow to an artifact type, you can view and edit the workflow state of artifacts of that type as you would any other attribute.
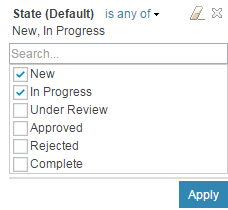
Filter by workflow state
You can now filter artifacts by workflow state.
Delete a workflow
You can now delete a workflow if it is not assigned to any of the artifact types in any of the configurations in a project.
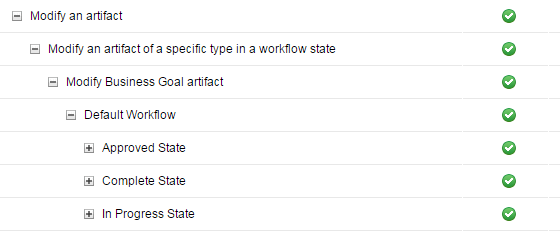
Workflow state permissions
By setting permissions on the workflow states, you can control which user roles can modify artifacts and attributes of those artifacts for each state of the workflow.
Examples:
In the Approved state, only users with the JazzAdmin role can modify any attribute. In the New state, all users can modify any attribute.
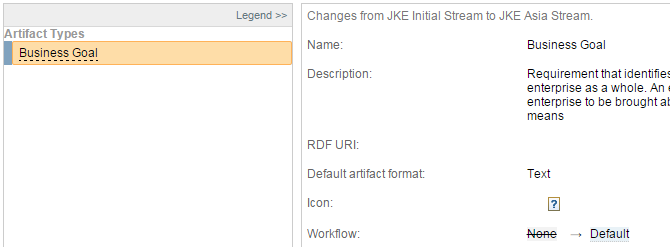
Compare or deliver artifact type workflows
Because you can assign workflow to artifact types, when you compare or deliver changes from one configuration to another, you can compare or deliver that change just like any other attribute change on that artifact type.
Project template creation and workflow definitions
When you create a project template by choosing the option to include Artifact Types and Attributes, the workflow definitions must be added to the template being used when you create a new project area under a template with those definitions.
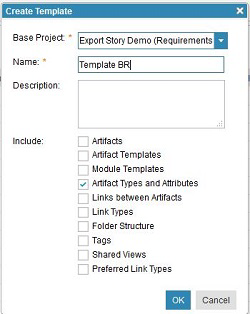
Which workflow definitions are created: The workflows registered in the current project before creating the template are created. For example, if the current project in the system has these following two workflows:
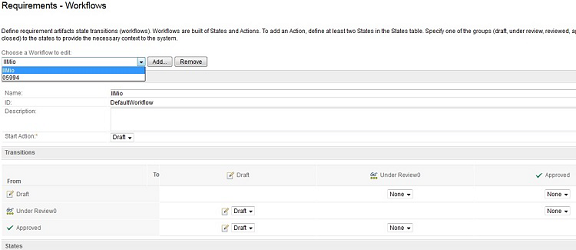
Why workflow definitions are useful: When you create a new project area, you can select the project template that you created before, so the new project area contains the workflow definitions that you added to that template.
Create a new project area to use the created template with workflow definitions:
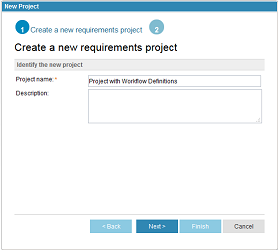
Then, select the template:
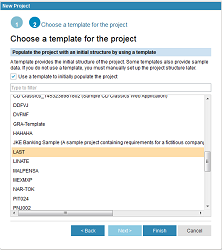
As result, you can see in the new project area that the workflows you included in the template are now used.
Improvements to round-trip import and export support for spreadsheet file formats
Support for XLS and XLSX file formats
In addition to CSV files, you can now generate XLS or XLSX files when you export requirements. After you select the Exportmenu option, a new window opens in which you can specify the file format:
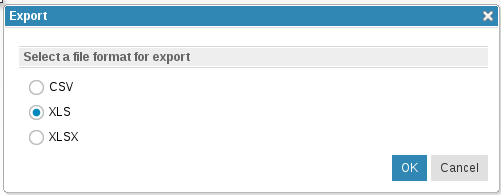
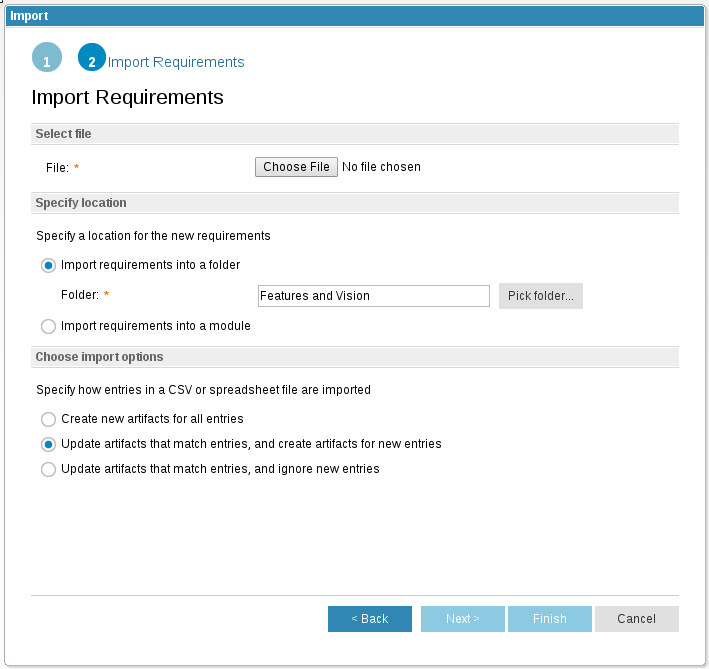
You can also use the import wizard to choose these file formats when you create or update requirements:
Export and import round-trip operations support links and embedded artifacts
Both CSV and spreadsheet export formats now show special markup for links and embedded artifacts. This markup can be used to retain or create links and embedded artifacts upon import.
You can export links by including a link column in the view. Links, images, or embedded artifacts can also be present in the primary text of the requirement, which can be shown in the view and subsequently exported.
In the exported file, links within link columns are represented as follows:
{LINK id=3129 uri=https://server/rm/resources/_abaf26f172a149b2aaf8f22933be1661}
Links within the primary text column are represented as follows:
"The text contains a link:{LINK id=3129 title=""3129: AMR Information Architecture"" uri=https://server/rm/resources/_abaf26f172a149b2aaf8f22933be1661}."
If you add a new link to an exported link column, a new link is created during the import process, using the type specified by the column name. If the new link is added to the primary text column before the import, a new link is not created.
In CSV files, the images and embedded artifacts are represented as follows:
{EMBEDDED id=3498 title=""new requirement"" uri=https://server/rm/resources/_klHmkbljEeWqUL0WZ--HjQ}
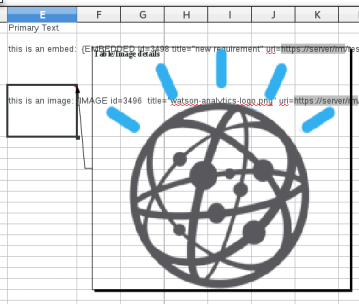
{IMAGE id=3496 title=""watson-analytics-logo.png"" uri=https://server/rm/wrappedResources/_dyVrMLljEeWqUL0WZ--HjQ
Additionally, in spreadsheet files, the images are included in the file, and can be seen as a comment on the spreadsheet cell:
When adding new references to images or embedded artifacts on import, only the identifier of the resource is needed. For example, to embed a reference to a requirement in the primary text of a requirement, the following markup could be used: {EMBEDDED id=123}
OSLC links are included in exported CSV files
When you export artifacts that contain OSLC links (Validated By, Implemented By, Affected By, and Tracked By) to another application’s resources, the CSV file displays each of them with this format: {LINK id=24 uri=https://... }. The value of the link URI depends on the current view that you are working in.
The following line is an example of how the link must be shown in the CSV file:
{LINK id=3129 uri=https://rm602.com:9443/qm/oslc_qm/contexts/_Tj9i0LiLEeWWFuQ1aZ9WjA/resources/com.ibm.rqm.planning.VersionedTestCase/_t451QLiWEeWk1cqv1JwgRA}
For example, consider an artifact that is linked to a Quality Management test case through a Validated By link. If you initiate a CSV export operation, the exported file shows the following results:

id,Name,Link:Validated By,Link:Implemented By,Link:Affected By,Link:Tracked By,Artifact Type
1261,RM Artifact,{LINK id=1 uri=https://rm602.com:9443/qm/oslc_qm/contexts/_Tj9i0LiLEeWWFuQ1aZ9WjA/resources/com.ibm.rqm.planning.VersionedTestCase/_t451QLiWEeWk1cqv1JwgRA},"","","",Feature
METADATA
Exported Artifact IDs=1261
Export Project Area=https://rm602.com:9444/rdm/process/project-areas/_PKm88LiLEeWwYpIdQ6WZhQ
Export Configuration=https://rm602.com:9443/gc/configuration/2
As the example shows, in the Link:Validated By information, the link is displayed in the previously specified format.
OSLC links are included in exported Microsoft Excel files
When you export artifacts that contain OSLC links (Validated By, Implemented By, Affected By, and Tracked By) to resources in another application, the Microsoft Excel file displays each of them in this format: {LINK id=24 uri=https://... }. The value of the link URI depends on the current view that you are working in.
The following line is an example of how the link must be shown in the Microsoft Excel file:
{LINK id=3129 uri=https://rm602.com:9443/qm/oslc_qm/contexts/_Tj9i0LiLEeWWFuQ1aZ9WjA/resources/com.ibm.rqm.planning.VersionedTestCase/_t451QLiWEeWk1cqv1JwgRA}
For example, consider an artifact that is linked to a Quality Management test case throught a Validated By link. If you initiate an Excel export operation, the exported file shows the following results:


As the example shows, in the Link:Validated By column, the link is displayed in the previously specified format.
OSLC links are created when you import Microsoft Excel files
When you import artifacts that contain OSLC links (as specified in the table below) to artifacts in another application, those links are created only if the current project contains an OSLC association to another application.
For example, if a Microsoft Excel file contains a Validated by link, the project must have an OSLC association to a Quality Management application that matches the specified link.
| Application | OSLC link types |
| Requirements Management | References, Referenced by |
| Quality Management | Validated by |
| Change and Configuration Management | Implemented by, Affected by, Tracked by |
| Design Management | Satisfied by architecture element, Refined by architecture element, Traced by architecture element |
The following line is an example of how the link must appear in the Excel file to import:
{LINK id=3129 uri=https://rm602.com:9443/qm/oslc_qm/contexts/_Tj9i0LiLEeWWFuQ1aZ9WjA/resources/com.ibm.rqm.planning.VersionedTestCase/_t451QLiWEeWk1cqv1JwgRA}
Consider that you have the following Excel file:

Import the file as a new entry:

The result is a new artifact with OSLC links.

Note: As a prerequisite, the project must have OSLC associations.
OSLC links are created when you import CSV files
When you import artifacts that contain OSLC links (as specified in the table below) to artifacts in another application, those links are created only if the current project contains an OSLC association to another application.
For example, if a CSV file contains a Validated by link, the project must have a OSLC association to a Quality Management application that matches the specified link to the CSV file.
| Application | OSLC Link Types |
| Requirement Managements | References, Referenced by |
| Quality Management | Validated by |
| Change and Configuration Management | Implemented by, Affected by, Tracked by |
| Design Management | Satisfied by architecture element, Refined by architecture element, Traced by architecture element |
The following line is an example of how the link must appear in the CSV file to be import:
{LINK id=3129 uri=https://rm602.com:9443/qm/oslc_qm/contexts/_Tj9i0LiLEeWWFuQ1aZ9WjA/resources/com.ibm.rqm.planning.VersionedTestCase/_t451QLiWEeWk1cqv1JwgRA}
Consider that you have the following CSV structure:
id,Name,Link:Validated By,Link:Implemented By,Link:Affected By,Link:Tracked By,Artifact Type
"",RM Artifact,{LINK id=1 uri=https://rm602.com:9443/qm/oslc_qm/contexts/_Tj9i0LiLEeWWFuQ1aZ9WjA/resources/com.ibm.rqm.planning.VersionedTestCase/_t451QLiWEeWk1cqv1JwgRA},"","","",Feature
METADATA
Exported Artifact IDs=1261
Export Project Area=https://rm602.com:9444/rdm/process/project-areas/_PKm88LiLEeWwYpIdQ6WZhQ
Export Configuration=https://rm602.com:9443/gc/configuration/2
Import the CSV file as a new entry:

The result is a new artifact with OSLC links.

Note: As a prerequisite, the project must have OSLC associations.
Enhancements to compare and merge
Attribute selection in the Merge Delivery wizard
When you deliver a change set by using the delivery wizard, if you select Express Delivery and the option Resolve according to defined policy, you are presented with an Attribute selection window. You use this window to select from a list of source attributes. In this policy, the selected dominant source attributes are used to overwrite any corresponding value in the merged target when a conflict occurs during the delivery.
Delivery policy selection

Dominant source attribute picker window
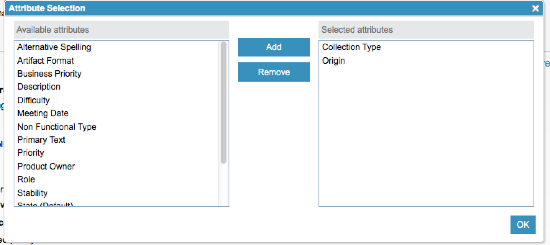
Selecting a policy to resolve conflicts in the Merge Delivery wizard
When you deliver a change set by using the delivery wizard, you can select a delivery policy in the wizard and have the server perform the delivery and resolve any conflicts according to that policy.
In the initial step of the delivery wizard, which confirms the source and target configurations, you can select the delivery policy under the Express delivery section. The server automatically resolves any conflicts according to the policy that is selected.

Notify me to manually resolve conflicts
- If you select this option, all non-conflicting changes are delivered.
- Any module structure conflicts are automatically resolved.
- Any remaining conflicts cause the delivery to fail and you are notified of conflicts that require manual resolution.
Always overwrite with source
- If you select this option, all non-conflicting changes are delivered.
- Any module structure conflicts are automatically resolved.
- Any remaining conflicts are resolved to where the version in the source is delivered.
Resolve according to defined policy
- If you select this option, all non-conflicting changes are delivered.
- Any module structure conflicts are automatically resolved.
- When this option is selected, a source attribute selection dialog box opens. The selected attributes are used to resolve any remaining conflicts, where the selected source attributes overwrite the corresponding value in the merged target.

Express delivery feature and Delivery API
When you deliver a change set, any personal streams that have a contribution from that change set are updated. The update removes each contribution of that change set.
Improvements to rich text editor toolbar
New menu buttons
The Rich Text Editor Toolbar is enhanced to include menu buttons for some of the editing operations.

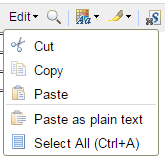
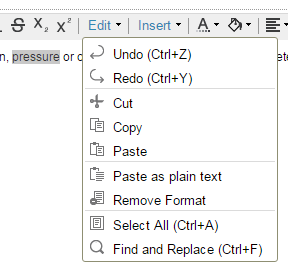
- The Edit menu button contains Cut, Copy, and Paste commands, along with the Select All command.
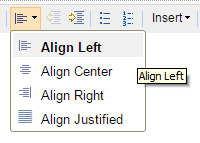
- The Align menu button contains the text alignment operations. The active alignment is displayed in bold font on the drop-down menu.
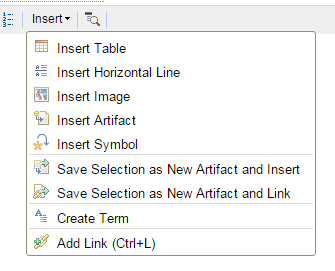
- The Insert menu button contains the insert operations, along with the Add Link, Save Selection as New Artifact, and Create Term operations. The Remove Link operation is no longer on the toolbar, but can be invoked from the editor context menu.
Editing rich text in the module editor, the collection editor, and on the artifacts page
When you edit Primary Text or Contents attribute fields in the module editor, the collection editor, or on the Artifacts page, the rich text toolbar is displayed at the top of the grid in place of the header row.

If the toolbar cannot be fully displayed on one line, a button for showing more or less of the toolbar is shown.

When focus moves out of the rich text cell, the toolbar disappears.
Edit menu
These toolbar items were moved to the Edit menu:
- Undo
- Redo
- Find and Replace
- Remove Format
Keyboard accessibility
When focus is in the editor cell, if you press Alt+F10, the focus moves to the first element on the toolbar. When the toolbar has focus, the following keystrokes can be used to navigate within the toolbar:
- Tab and Shift+Tab move focus between the toolbar groups.
- Left Arrow and Right Arrow move focus between the items in a toolbar group.
- Esc places focus back into the editor cell.
Improvements to module editing
Most grid cells edited via pop-up editors
In past releases, when a grid row was placed in edit mode, it would result in inline cell editors appearing for all of the editable cells within the row. This approach was problematic for editable cells in narrow columns. The Requirements Management application now uses pop-up editors for all fields except for the following: Contents, Primary Text, Name, Description, and Alternative Spellings. The vertical spaced provided by using a pop-up editor makes the cell editors intuitive and approachable. The following image shows an example of one of these editors:
![[An example popup editor (for Boolean)]](https://jazz.net/downloads/pages/rational-doors-next-generation/6.0.2/6.0.2/images/Boolean_Popup_Editor.png)
Different keys for navigation when editing rows
In past releases, when you placed a grid row in edit mode, you pressed Tab and Shift+Tab to move forward and backward between all the editable fields. In addition, tabbing past the last editable cell (or before the first editable cell) would commit the changes and put the row back into view mode.
The introduction of pop-up editors has changed this tab-based approach to navigation. When a row is in edit mode, you now press the Right Arrow and Left Arrow keys to move between the cells. When focus is on an editable cell, you can press Enter to change the cell value. If the cell is based on a pop-up editor, such as Priority, a pop-up editor is displayed and focus is placed within the pop-up editor. If the cell is based on an inline editor, such as Name or Contents, the focus is moved into the inline editor within the cell. To get out of an inline editor, press Tab to move the focus back to the enveloping cell. From there, you can press the Right Arrow and Left Arrow keys to move focus to adjacent cell editors. To save your changes, move focus somewhere outside of the row or, as in previous releases, press Ctrl+S.
New filterable grid widget for user and enumeration attributes
For user and enumeration attributes, there is a new widget with a filter field that is used for editing in the grid. For single value attributes, labels are used for selection. For multiple value attributes, check boxes are used. The new widget is accessible to keyboard navigation.
Tooltip associated with cell edit buttons includes the attribute name
In previous releases, hovering over the edit button for a particular grid cell resulted in a tooltip with the text Edit. This tooltip is now changed so that it also mentions the attribute, for example, Edit Priority.
Automatic pop-up help only appears for the contents cell
In previous releases, the automatic pop-up help would appear the first three times you put a module row into edit mode. Now, this automatic pop-up help is only shown for the Contents cell, whereas previously it was shown for every editable cell within the row. This change was required to enable the pop-up editors to be displayed.
DateTime attribute pop-up editor
You can now edit the DateTime attribute by using a pop-up editor with a date text input and an inline calendar, and a time text input with a drop-down time selector. The drop-down time selector is a list of times in the 24-hour system in 15-minute increments.

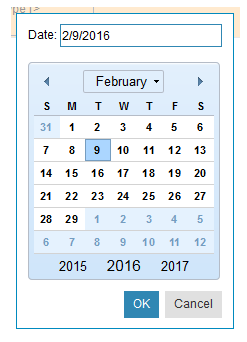
Date attribute pop-up editor
You can edit the Date attribute by using an attribute pop-up editor with a text input and an inline calendar. When you select a date in the inline calendar, the text input updates accordingly. When you enter a date into the text input, the calendar is updated when focus is placed away from the text input.
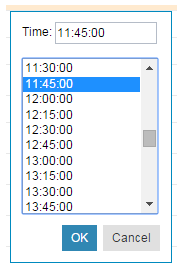
Time attribute pop-up editor
You can edit the Time attribute by uisng an attribute pop-up editor with a text input and an inline time selector. The text input allows you to enter time in HH:mm:ss format and the time selector is a list of times in the 24-hour system in 15-minute increments.
Permanently remove data from repository
Delete from Repository tab
A new tab, Delete from Repository, was added to the Project Properties page for Jazz administrator users. The Delete from Repository page contains a tool that enables you to permanently delete (purge) resources from the repository based on versioned resource URLs, as opposed to archiving them.
Export data dump tool
A export tool is available for Jazz administrators to transcribe (dump) resources from a component area to the server file system. This tool helps you identify resources that might contain sensitive information, even if they have already been archived. After you set the "data.purge.enabled" advanced server property, the tool is available from the Delete from Repository tab on the Project Properties page.
Improved Rational DOORS 9 migration
With ReqIF export, include artifact identifiers
Artifact identifiers are now included in ReqIF export operations. The identifiers are imported as “ForeignID” by applications that follow the ProSTEP ReqIF Implementation Guide, or as “ReqIF.ForeignID” for applications that do not.
Following the recommendations in the ProSTEP ReqIF Implementation Guide, the values are exported by using a special “ReqIF.ForeignID” attribute. Applications that follow this guide import these values as “ForeignID”, and do not return them in round-trip export operations. Applications that follow the guide include IBM DOORS and IBM DOORS Next Generation.
Applications that do not follow the implementation guide import the values as “ReqIF.ForeignID”, and might include them in export operations.
Migration import from Rational DOORS 9: Artifact type and link type equality matching
When you import a migration file from Rational DOORS 9, if the identifier does not already exist in the project, artifact types and link types are now determined equal, or otherwise, according to their properties, such as default format and attribute definitions. If the identifier already exists in the project, matching continues to be based on the identifier.
When you import a migration file from Rational DOORS 9, data types and attribute definitions are now determined equal, or otherwise, according to the data type or attribute definition’s properties (for example, name, bounds, and default value). Migration matching for data types and attribute definitions no longer occurs based on identifier or RDF URI.
Miscellaneous improvements
Support for cross-project links with user-defined link types
User-defined links that have a RDF URI set should behave as system links. The following behavior is supported:
- Create cross-project links:
- Artifact grid
- Links sidebar
- Drag and drop
- Display cross-project links in both projects:
- Artifacts grid
- Links sidebar
- Links explorer
- Edit/remove cross-project links from both projects:
- Artifacts grid
- Links sidebar
- Links explorer
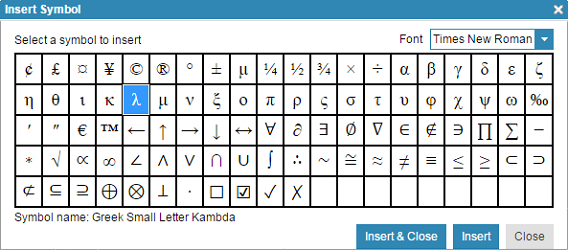
Insert symbol plug-in
A plug-in was added to the editor that enables you to insert special characters. The plug-in is available in the rich-text artifact editor, the comment editor, and the floating module editor. The following image shows the button to open the window and the window.

Saved views with lifecycle filters
In lifecycle projects, saved views that contain lifecycle filters behave in the same way for both projects that are enabled for configuration management and that are not.
Import and extract wizards support filtering by module type
The Import Requirements and Extract Requirements wizards now filter the list of artifact types for the new module to show only module format types with a More option to display all types. In addition, the artifact types for the created requirements in the next step are also filtered by the module type’s preferred types, if they exist, with another More option.
Copy from project: Correlating types by the same RDF URI or title
The Copy From Project operation that performs type system alignment was modified to correlate by title if the sameAs RDF URI property was missing or did not find any correlations. This makes the feature less sensitive to typing errors or missed entries.
Used In collections and reviews columns
Collections and Reviews are new grid columns that list all the collections or reviews that the artifact is used in.
(Source: What’s New In DNG 6.0.2)
Rational Quality Manager
Manual test script customization
You can now customize templates and sections for manual test scripts. You can create a new template and use it to create a manual test script. Manual test script steps can now have custom attributes. You can reorder the predefined and custom attributes in manual test steps. Enumeration type custom attributes in a manual test script steps support type-ahead drop-down lists. You can now use the action menu on manual test script steps to insert a new step before or after the current step by copying the current step’s custom attribute values. New attributes are shown on the manual Execution page (read-only) and in the Result Details section of a test case result (read-only). Finally, the RQM Word/Excel Importer and offline execution features also support custom attributes for manual test script steps.
For more information, see Work Item 137041: Support customization of manual test script.
Custom attribute for manual test script steps
Previously, manual test script steps had the following predefined attributes:
- Description
- Expected Result
- Attachments/Links
Manual test script steps can now have custom attributes. The following types of attributes are supported:
- Small String
- Medium String
- Integer
- Enumeration1
- Date/Time
1 Manual test script steps only.
To define the custom attributes for manual tests script steps, go to Project Properties > Custom Attributes > Manual Step Attributes. Attributes created for manual test script steps apply to manual test scripts, and also to the manual Execution page (read-only) and the Result Details section of test case results (read-only).

Manual test script template
A new template type is now available in the product by default: Default manual test script template. The new template has the following sections:
- Summary
- Formal Reviews
- Manual Steps
- Associated E-Signatures
The manual test script steps section contains three predefined attributes:
- Description
- Expected Result
- Attachments/Links
You can create custom templates to create manual test scripts. You can create or remove sections from the template. The Manual Steps section has a special editing capability. By default, the Manual Steps section contains the three predefined attributes.
However, you can edit the Manual Steps section to add custom attributes. You can also reorder the attributes for the section. Ideally, you should create the custom attributes for manual test script steps as required and create a new manual test script template to include these custom attributes in the Manual Steps section.
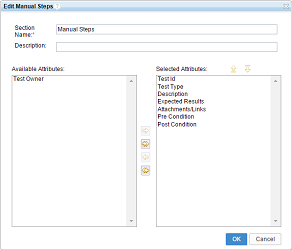
Customized manual test script editor
When you create a manual test script, you can select a template from the list of available manual test script templates. The default manual test script template is selected by default. You can choose the template only for manual test scripts; this feature is not available for other kinds of test scripts, such as command-line test scripts or Selenium test scripts. You can add or remove sections from the manual test script.
The Manual Steps section now has a Change Column Display Setting button. You can use the button to add, remove, or reorder attributes (both predefined and custom attributes). The changes apply only to the current manual test script. Any changes to the column width are applied to all manual test scripts of the same type. All required attributes for this section are marked with an asterisk (*) in the column heading. If a value is not provided for a required custom attribute, an error message is displayed.
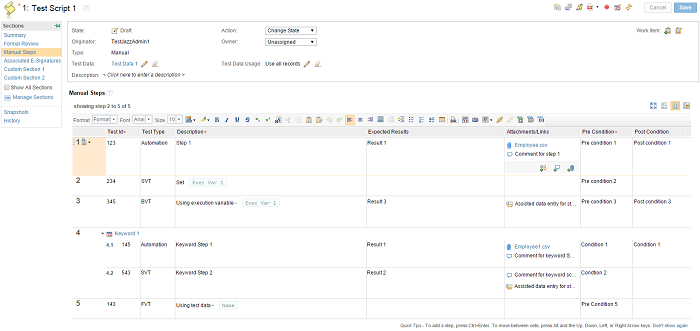
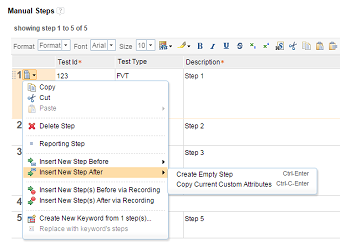
You can now use the action menu to insert a new step before or after the current step by copying the current step’s custom attribute values. The custom attribute columns are populated with the current step’s custom attribute values for the newly created step. Also, you can use the following keyboard shortcuts:
- Ctrl+Shift+C+Enter: Insert a new step before the current step with the same custom attribute values.
- Ctrl+C+Enter: Insert a new step after the current step with the same custom attribute values.
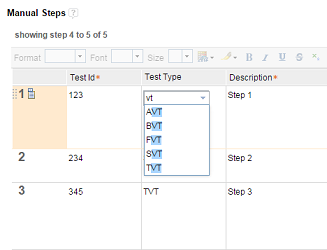
The Enumeration columns now have type-ahead drop-down lists when you edit them. The values in the drop-down list are filtered based on the text that you type in the field.
Manual execution page and test case result editor
The layout that you define in the Manual Steps section is shown on the manual Execution page as well as in the Result Details section of the test case result. Manual test script attributes are read-only in both locations except for Attachments/Links. You can use the Change Column Display Setting button to customize the layout. Any changes are applied to all manual test script executions and results of the same type.
Excel/Word Importer and offline test execution
When you import manual test scripts from Microsoft Word or Microsoft Excel by using the RQM Excel/Word Importer feature, you can map a column to a custom attribute for manual test script steps by completing the following steps:
- Create the custom attributes for the manual test script steps.
- Create a manual test script template.
- Include the custom attributes in the Manual Steps section.
- Mark the new template as the default template.
Map the column to the custom attribute by using the following configuration:
testscript.steps.customAttributes identifier="PreCondition".name="Pre Condition".value=G
testscript.steps.customAttributes identifier="PostCondition".name="Post Condition".value=H
In this example, column G is mapped to a custom attribute named Pre Condition and column H is mapped to a custom attribute Post Condition. The same facility is supported for importing Microsoft Word documents.
For offline test execution, the custom attributes are shown after exporting the RQMS file into Microsoft Excel. Custom attributes of the manual test script steps are shown in read-only mode.
Administration
Unique names for test environments
Project administrators can enforce unique names for test environments. By enabling unique names, you can ensure that that new test environments do not reuse existing names. You can enable or disable this option in the project area configuration in the Name Uniqueness section and select or clear the option for test environments. If this project setting is enabled and you try to create or rename a test environment with an existing name, a message prompts you to use a different name. Existing test environments are not affected by this setting until you try to modify them after the property is enabled.
Test execution
Rerun a test from a test case result
You can rerun a test case result. When you rerun the test case result, the following attributes are automatically picked up from the previous run:
- Test script
- Test case execution record
- Execution variable value set in the previous run
For remote script execution, you are prompted to choose an adapter from a list of available adapters. By default, the adapter used in the previous run is selected if it is available. The Rerun option is available from the test case result editor and browse test cases view.

The Rerun option is not available for scriptless execution.
For more information, see Work Item 143563: Provide the ability to re-run a test via a Test Case Result.
Exclude test suite steps with no associated scripts during scheduled execution
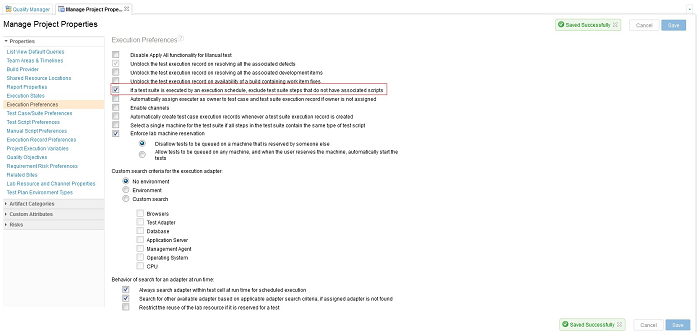
A new project property named If a test suite is executed by an execution schedule, exclude test suite steps that do not have associated scripts is provided in the Execution Preferences. While creating an execution schedule, you must have an associated test script for each step of the test suite. You can archive the associated test script later or remove it from the test suite step. If this property is enabled, those steps are excluded while the test suite is running from an execution schedule. No execution request or result is created for that step. By default, this new preference is not enabled.
For more information, see Work Item 138627: Test: Execution Schedule stuck when executing TSER with test script of one of the test case deleted.
Smart card authentication support for Command Line Adapter and Selenium Adapter
You can now use a smart card to authenticate a Rational Quality Manager server while starting the RQM Command Line Adapter or RQM Selenium Adapter. To use the smart card authentication method, you must pass the values for the following arguments while you start the adapter:
| Argument name | Argument value |
|---|---|
| -authType | KERBEROS |
| -kerberosConfigPath | Path to the Kerberos configuration file. Example: C:\Windows\krb5.ini |
You can also pass the values inside configuration file using following property names:
| Property name | Property value |
|---|---|
| rqm.authType | KERBEROS |
| rqm.kerberosConfigPath | Path to the Kerberos configuration file. Example: C:\Windows\krb5.ini |
For more information, see the readme files for each adapter.
Configuration management
Option to avoid creating versions of execution results when you create a stream
By default, when you create a stream from a baseline, all the artifacts from the baseline appear in the stream. You can now set an option to omit the execution results in the baseline from appearing in the new stream. The option is available in Manage Project Properties in the Configuration Preferences section, and is named Exclude test case results and test suite results from new streams.
Notification when copying artifacts to another project that has global configurations enabled
A warning message is now displayed when you copy artifacts from one project that has global configurations enabled to another project that has global configurations enabled. The warning states that you must properly configure the global configuration for the destination project for copied links to work correctly.
Table views
Support for default predefined query in table list views
The table list views that open from the Browse menu display all the artifacts without any filter. A new project property named List View Default Queries is available. An administrator can select a shared saved query as the default query for the supported table list views. The default query of the list view runs when the table list view is opened instead of showing all artifacts.
The same List View Default Queries property was also added in the user preferences. The supported table list views in the user preferences use the default query that is set in the project property. You can override the settings to not have a default query, or you can select another saved query, including both shared and personal queries. A Set Default Query button was added to the supported table list views to open the user preferences window to the List View Default Queries section.
The supported table list views are as follows:
- Test plans
- Test cases
- Test scripts
- Test suites
- Test case execution records
- Test suite execution records
- Test case results
- Test suite results
- Test data
- Keywords
- Execution schedules
- Execution console
- Adapter console
- Scheduled jobs
- Build records
- Build definitions
Improved consistency across all table views
All Rational Quality Manager table views now render test artifact links in a consistent way. Table view cells with a single test artifact link render the link by using following format:
<test artifact icon> <test artifact web ID>: <test artifact name>
Table view cells with multiple test artifact links render the links by using following format:
<test artifact icon> <1>, <test artifact icon> <2>,...<test artifact icon> <n>
The same format is used in PDF table summary reports.
Artifact editors
Ability to link to existing work items in artifact editor sections
In the section of an artifact editor, you can now create a quality task work item that links to the section. You can also add a link to existing work items from the artifact editor sections.
Excel/Word Importer
Support for HTML tags in Microsoft Excel import operations
A new HTML modifier is available for importing data from Microsoft Excel. You can use the HTML modifier to include HTML content in rich-text properties, for example, adding a table to a manual test script step. The data can be a combination of user-defined text, a cell number, or a column name. Example:
testscript.steps.description=HTML("<table><tbody><tr><td>" & B & "</td><td>" & C & "</td></tr></tbody></table>")
In this example, an HTML table is created with one row and two cells that contain the content of cells in columns B and C.
testscript.steps.description=HTML(C3)
In this example, the contents of C3 cell contain HTML content.
RQM Reportable REST API
Support for nested PUT requests for select relationships
The Reportable REST API now supports nested PUT requests for a select set of relationships. This support allows you to create and update dependencies for a resource that has PUT requests in the same HTTP request, which eliminates the overhead associated with successive PUT requests.
Nested PUT requests are supported for the following relationships:
- Execution result > Execution work item
- Execution work item > Test case
- Execution work item > Configuration
- Execution work item > Test phase
- Test phase > Test plan
- Test plan > Test case
For more information, see Nested PUT on the Jazz.net wiki.
OSLC QM API
Support for Plain Old XML (POX) profile requests
The OSLC QM V2 API now supports Plain Old XML (POX) profile requests. When you use the RQM Reportable REST API to request test resources, Plain Old XML or POX is returned. Sometimes the POX contains OSLC-style links to OSLC resources. When requesting these OSLC resources, RDF/XML is returned. However, RDF/XML is difficult to process using standard XML processing technologies, such as XPath. In addition, some clients (for example, Rational Publishing Engine [RPE]) cannot consume RDF/XML. When requesting these OSLC resources with a POX profile request, POX is returned.
For more information see Plain Old XML (POX) profile requests.
Support for rolling up requirements to test cases when links are created
When the project preference for test scripts, Copy requirement links to test case from test script steps when child test script is added, is enabled, the behavior now also applies when a requirement link is added to a step using the OSLC QM API. In this scenario, a link is automatically created from the test case to the requirement that was linked to the test script step.
This new feature supports Rational DOORS 9, with link discovery enabled, to link to a test script step and then view the test case link association created from Rational Quality Manager from within Rational DOORS 9.
(Source: What’s New in RQM 6.0.2)
Rational Team Concert
Tracking and planning
My Stuff
Create work items from My Stuff views
You can now quickly create work items from the following views on the My Stuff page:
- My Work
- My Subscribed
- All Work

By default, the work item is created in the first project of the selected projects. You can change the project by using the project area button as shown in the following image.

You can use other buttons below the quick create box to provide values for the following attributes of the work item:
- Type (*)
- Description
- Filed Against (^)
- Owned By (@:)
- Priority ($)
- Severity (!)
- Tags (#)
- Found In (>)
- Due Date
- Subscribed By (@)
- Parent (->)
You can provide a summary of the work item by typing into the text box. You can also provide these attribute values directly in the text box. For help with possible entries, press Ctrl+Space.

Enhancements in filtering
You can now add subscribers as a filter criteria. You can provide a short-form filter by using the identifier “@” or you can give a full-length filter.

The following short-form identifiers were added for filtering:
- Filed Against (^)
- Found In (>)
Editing custom view properties on the My Stuff page
A new properties dialog box is available for custom views. To open the dialog box, click the drop-down symbol on a custom view entry in the side menu.

The menu also provides a quick sharing option:
- <Selected Projects>: Share the current view with the projects that are selected in the Project Selection drop-down list at the top of the page.
- <My Projects>: Share the current view with my projects (the projects of which I am a member).
- <All Projects>: Share the current view with all available projects.
- Unshare: Completely unshare the current view.
You can also open the properties dialog box when you create a new custom view by clicking the Save button.

You can use the dialog box for these actions:
- Change the view’s name.
- Set whether the view should filter for a given iteration.
- Change the view’s sharing properties.
- Add and remove tags on the view.

To add tags or sharing properties, use the plus sign (+) icon on the right of the appropriate dialog box section.
My Recent view
This release adds a new view called My Recent to the My Stuff page. The My Recent view shows all work items that you recently viewed (from the work item editor) and modified (either on the My Stuff page or Quick Planner page).
Quick filter variables
Filtering on the My Stuff page supports the following variables:
- Current User variable: A variable that matches the current user.
- Current Iteration variable: A variable that matches the current iteration.
- Unassigned variable: A variable that matches no iteration.
Quick Planner
My Recent view
The My Recent view in Quick Planner was enhanced to also show recently viewed work items from the Work Item editor.
Quick filter variables
Filtering in Quick Planner supports the following variables:
- Current User variable: A variable that matches the current user.
- Current Iteration variable: A variable that matches the current iteration.
- Unassigned variable: A variable that matches no iteration.
Enhancements for creating work items
Values for more attributes are now supported. You can provide values for other attributes by typing into the text box. To see content-assist suggestions, press Ctrl+Space.

Enhancements in filtering
You can now filter work items by subscribers. In addition, there is added support for more short-form identifiers for filtering.
- Filed Against (^)
- Found In (>)
- Subscribed By (@)

Editing custom view properties in Quick Planner
For custom views, a new properties dialog box is available. To open the dialog box, click the drop-down menu for a custom view entry in the side bar.

Note that the previous menu entries for quick sharing were preserved in the menu.
The properties dialog box is also shown when you create a new custom view by clicking the Save button.

You can use the dialog box for these actions:
- Change the view’s name.
- Set whether a given iteration is included as a filter.
- Change the view’s sharing properties.
- Add and remove tags to the view.

To add tags or sharing properties, use the plus sign (+) icon on the right of the appropriate dialog box section.
Work items
Work item editor Filed Against category filters Planned For iterations
The values for iterations shown in the Planned For drop-down list (both in the web and Eclipse clients) now depend on the currently selected timeline (Filed Against category > Team Area > Timeline):


Additionally, the work item editor in the web client provides a new dialog box for selecting iterations, which displays all project area timelines and contained iterations in a tree view. Project timeline, current iterations, and backlog iterations are marked with special icons as shown in the following image:

A warning icon and warning tooltip message is shown in both the web and Eclipse work item editor when the selected iteration does not belong to the selected timeline:


You can change or disable the text of the new warning message for the Planned For attribute by using the web or Eclipse project area editor:


String variables in work item templates
Work item templates now support string variables. The string variables must be defined in the format in the Summary or Description fields.
Note: The ID can contain only alphanumeric characters and underscores.

When the template is instantiated, each variable is replaced with a user-specified value.

The values that you provide appear in the generated work items.

Note: This feature is supported in all clients (Eclipse, web, and Visual Studio).
Improve email templates
Email templates were extended with two new variables:
Category Path:
Outputs the qualified path of the category. By default, the path separator is the forward slash (/). Example: “Development / Server /Services”.
Supports the following functions:
- setSeparator(): Change path segment separator. Example:
- get(i): Get specific path segment. Example:
Subscribers:
Returns a list of subscribers of a work item (each represented by the existing variable). The new functionality is similar to that of the variable.
Supports the following functions:
- get(i): Get ith contributor from the list. Example:
- takeFirst(i): Returns the first i subscribers. Example:
- dropFirst(i): Returns the list without the first i subscribers. Example:
Jazz source control
Baseline history graph
In this release, a graphical view was added that shows how streams and repository workspaces evolved over time and their interactions with one another based on baseline flow operations. This new view enables you to see how changes flow across release streams, easily see where baselines are used in different streams, and compare the contents of two streams or repository workspaces at the time of the baseline operation.
You can open this view from either the Eclipse or Visual Studio client by selecting a component of a stream or repository workspace in the Team Artifacts view.

Show more streams
When you open this view for the first time, it shows only the stream or repository workspace on which it was invoked. The view is a graphical representation of the baseline history view. You can add more streams or repository workspaces to this diagram by clicking the Add Streams icon in the upper right.

Customize the information shown
By default, this diagram shows how baselines flow between streams and repository workspaces. It also hides certain baseline operation nodes that are less important to many users, such as backup baselines that are created as a side-effect when you replace the baseline in your repository workspace. You can change the default settings to filter out certain information, depending on your needs.
Here are the available filters:
- Show only releases: Show only the baselines that are included in a released build snapshot. A released build is one that has been associated with a release on the Releases page of the Project Area editor.
- Hide backup baselines: Backup baselines are created automatically to preserve changes when replacing or removing a component in a workspace or stream. This filter hides those backup baselines in the diagram.
- Hide baselines that do not bring in changes: Not all operations performed on a workspace or stream introduce new changes. This filter hides baseline operations in the diagram that do not contain any additional content when compared to the previous operation on that stream or workspace.
- Hide accepted baselines: Hide operations that represent accept or deliver of baselines to a workspace or stream.
- Show baselines by a specific filter: Show only those baselines that match specific criteria, such as certain tags or name prefixes.
The following use cases are common ones.
Show all information to debug a build issue
As a release engineer, I want to see recent builds, what was included in them, and how they were delivered (or accepted) into other streams.
To track the issue, you can add all repository workspaces and streams that are involved in the build process and turn off all the filters, which results in a view similar to the following one.

In this example, the team has an “SCM Integration Stream” where developers deliver their changes for the SCM component, and a corresponding “SCM Integration Build Workspace” where the build runs. When a build passes testing, it is delivered to the “GZ SCM Integration Stream” (which is a “green zone” used for final testing), before delivering changes to the higher level “RTC Integration Stream.”
Show how streams are branched and merged
As a release manager, I want to see when a side stream is branched for a different release or development work, and when it is merged back into the main stream.
In this case, you do not want to show the intermediate streams and repository workspaces that are involved in the build process. Instead, you can show only the two main streams. Showing the individual baselines will show when the streams are branched and merged.

The previous example shows the main development stream, which in this case represents the 6.0.2 release, and a side stream used to work on “Feature X.” The history graph shows that the “Feature X Side Stream” forked from the 6.0.1 final build initially. It also shows that it accepted some fixes from the main stream and eventually created a “Side Stream Baseline 1” at presumably a stable point in the feature development. You can see that this baseline was then merged back into the main stream shortly after.
Show baselines for final releases only
As a product manager, I don’t want to see all the details for daily builds, branches, and merges; I want to see only the baselines that represent final releases.
In this case, you do not want to show the intermediate streams and repository workspaces that are involved in the build process. Instead, you can show only the two main release streams. Showing the individual baselines will show when the releases are branched and merged.
In this case, you filter out all baselines except for those that were released, as shown below.

This view shows an example of a component that is reused in multiple products. The Map team develops and releases new versions of the Map Component. The GPS team reuses certain releases from the Map team in their GPS product. The Phone team reuses certain releases from the GPS team in their Phone product. Therefore, the Map Component is included in releases in all three streams. This view shows all the releases.
Operations supported in this diagram
You can perform the following operations from this view:
Compare baselines
You can select any two baselines in the diagram and see their differences. This feature is useful when you need to determine what is included in a new build or what has changed between two releases.

Show baseline repository files
You can select any baseline in the view and see its contents. This feature is useful for developers to dive into the details of a baseline to debug problems.

Other features
Remember the last viewing preferences for a component
For convenience, Rational Team Concert remembers which streams were displayed and which filters were set the last time you viewed a component, and opens the view the same way the next time you open that component. This setting is saved for each user for each component.
Show the view in an external browser
You can choose to open the view in an external browser. The operations that open native client views (compare baselines, show baseline repository files) are not available from an external browser.
The following image shows the option for setting the Eclipse client to show the Baseline History Graph in an external browser.

Show baseline history graph in Shell client
You can also open the baseline history graph from the Shell client but it is displayed in an external browser. You can still interact with the graph but you can’t perform operations, such as compare baselines, that require full, rich client support.
Code review usability improvements
Several enhancements were made to the code review feature that was first introduced in 6.0.1:
- A checklist is available to guide you through the requirements needed to start a review.
- You can now select intermediate before and after states in the compare editor.
- You can create work items from issues.
- You can now select before and after states in the compare editor.
- You can export code review data in JSON or XML format for reporting.
- Administrators can delete code review issues.
Each enhancement is described in the following sections.
Code review checklist
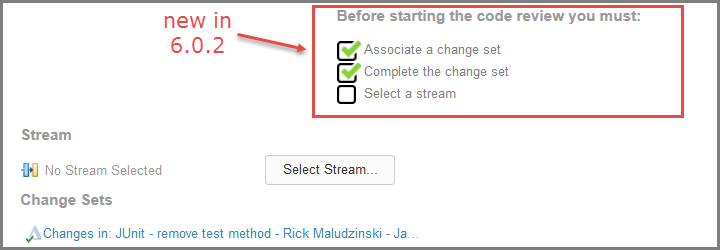
The code review section was modified to provide a checklist that guides you through the requirements that must be satisfied to start the review. The requirements are as follows:
- Change sets must be associated with the work item.
- The change sets must be completed.
- A target stream where the changes will be delivered must be set.
The following diagram shows the new checklist. In this example, a completed change set has been associated with the work item so that the only remaining action is to select the target stream. After the stream is selected, the checklist is replaced with the code review summary information and a button to open the code review.
Ability to select before and after states in the compare editor
You can now select the before and after file states of the associated change sets by using a drop-down list in the compare editor. With this feature, you can now perform code reviews even if the change sets contain gaps.

Create work items from issues
You can now create work items from issues raised during a code review. This feature is useful if a valid issue is raised that requires additional development work, but is not necessarily part of the current review cycle. In the following image, you can see that work items 51 and 52 were extracted from the issue editor.

Click ![]() to open the dialog bos to create a new work item with the Summary field populated and a link as shown in the following image.
to open the dialog bos to create a new work item with the Summary field populated and a link as shown in the following image.

New command to export code review data
A Command Line Interface (CLI) command was added to generate a code review report based on a work item query. Two output formats are supported: JSON and XML.
Example:
scm export code-review <queryID> <outputFile> <format> [<includeCsDeliveryInfo>] -r <login details>
where:
- queryID is the UUID of a work item query that returns a set of work items that have had a code review
- outputFile is the location of the code review data to be saved
- format is the required output format ( JSON or XML)
- includeCSDeliveryInfo is used to determine whether to extract the delivery information for the attached change sets. Include this information if you want to extract the information; otherwise, leave it blank.
Ability to delete data from code review
You might need to delete data for several reasons. A comment might disclose classified information, or a reference to material might later become classified. Now, project administrators have the ability to delete issues. Administrators (with JazzAdmins repository permission) can now use a Delete button in the issue editor as shown in the following image. Clicking Delete opens a dialog box that prompts whether to proceed. After an issue is deleted, it cannot be restored.

Locking streams and components
You can now lock streams and components in streams to prevent deliveries to the files in those streams or components. Stream and component locks work in a similar manner to file locks but apply to the entire stream or the entire component in a stream. When a stream or component is locked, any attempted deliveries by users who do not own the lock will fail with an appropriate error message. The user that holds the lock can still perform deliveries to the stream. A lock does not only prevent deliveries, it also prevents any operation that affects the files in the locked component or stream. For example, a component replace is also prevented.
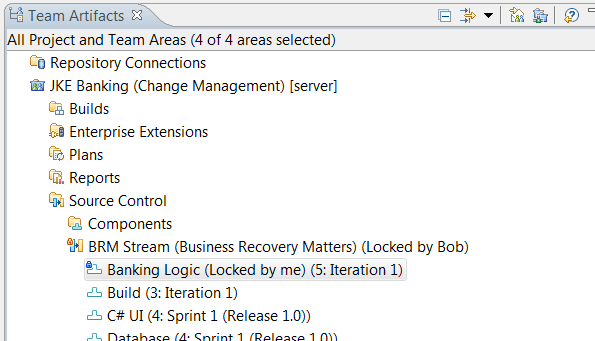
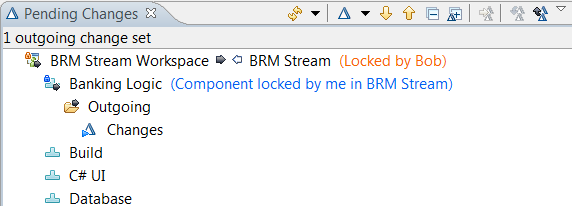
The previous image shows a stream that is locked by Bob and a component in that stream that is locked by the current user. Streams and components in a stream can be locked and unlocked from the context menu in the Team Artifacts view and are decorated in that view, as shown in the image. For components, actions to lock and unlock a component hierarchy are also provided. Decorations also appear on Workspaces in the Pending Changes view when a lock exists in the stream or component that is the currently active outgoing flow target for the workspace, as shown in the following figure. The current user cannot deliver a change because, even though he owns the component lock, Bob owns the stream lock.
The ability to lock a stream or component is controlled by a role-based permission, as shown in the following image. Anyone with a role that has the permission assigned can lock or unlock a stream or component. In addition, users with the required permission can transfer a lock from another user by requesting the lock themselves.

Locks in the Repository files view
A decoration is now shown on files, components, and streams in the Repository files view. When the view shows files for a stream, the locks in the stream are shown. When the view shows files for a workspace, the locks in the stream that is the outgoing flow target are shown.

Component hierarchies in the Pending Changes view
Component hierarchies appear in the Pending Changes view as shown in the following image. The hierarchy shown is the hierarchy in the workspace. Decorators for incoming, outgoing, and unresolved changes, as well as conflicts, are propagated to parent components.
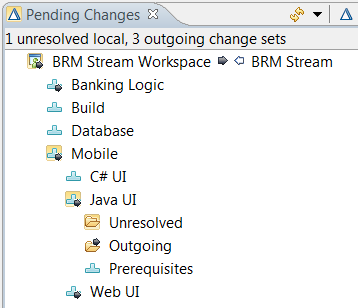
You can enable and disable the display of components in a hierarchy on the Team/Jazz Source Control/Changes preference page.

Local change preservation on accept
Several actions update files in a repository workspace, including accept, resume, discard, or replace. If the repository workspace is loaded into a sandbox when these actions are performed, any conflicts between local changes that are not checked in and changes that are accepted result in losing the local changes. For this reason, users are always prompted about changes that are not checked in when they perform one of these actions.
In this release,these actions were enhanced to preserve the local changes in most cases. If a file has conflicting changes, the contents are automatically merged if possible. If it is not possible to merge the changes, a local conflict occurs so you know about the conflicting changes, as shown in the following image.

In some extreme cases, local changes cannot be preserved in-place. For this reason, the prompt still occurs when accepting or performing one of the other mentioned actions. Also, a Jazz Source Control console was added where you can see which files were backed up either to the Eclipse local history or to the SCM shed, as shown in the following image.

Load workspace into sandbox subfolders
In the Eclipse wizard for loading workspaces into the sandbox, you can now specificy a subfolder within the sandbox in which to place the workspace component files. This feature makes it possible to load multiple workspaces within the same sandbox even if the workspaces contain the same component with different content.
In the Load wizard, in the Advanced Option section, you can load component files into a subfolder of the sandbox. You can specify the subfolder or you can use the default folder with the same name as the repository workspace. With this option set, you can load multiple versions of the same component to the same sandbox, which enables the development of multiple versions of similar software without switching sandboxes. Note that if you use Eclipse projects, loading Eclipse projects with the same name causes problems for Eclipse, even if you load the projects in different subfolders.

This option is off by default, so the behavior doesn’t change from earlier releases. After the option is set and a folder is selected, the setting is used for all future loads for that repository workspace. To change this setting (either to turn it on or off, or to change a subfolder), unload the repository workspace and use the Load wizard to change the setting when you load the repository workspace again.
You can change the default setting on a project area basis, which means that all repository workspaces that have a flow target that is a member of the project area can have the usage of subfolders during load turned on by default. The individual setting of the repository workspace still overrides the default setting for the project area. You can change the default setting for a project area from both Eclipse and the web client.

In the web client, you can change the default setting for a project area under the Source Control > Sandbox Subfolder of the project area.

In the Eclipse client, you can change the default setting for a project area on the Process Configuration tab of the project area, under Project Configuration > Configuration Data > Source Control > Workspace Sandbox Subfolder.
Move files across components in the CLI
Before this release, you could only move folders from one component to another while preserving the file history. Now, you can move files to another component by using the SCM CLI. The general syntax of the command is as follows:
scm move repository-path -w <workspace>
-S <source-component> -D <target-component>
source-file-path destination-parent-path
For details, see the CLI help (scm help move repository-path). Example:
scm move repository-path -w "My Workspace"
-S "Team Component" -D "Other Component"
/JavaMan/src/a/b/E.java /Project/src/a/b/
Display the sandbox structure in CLI
You can load a workspace in many ways. You can load projects in the component root folder or into a deeply nested directory in the sandbox. Running the status subcommand only shows which components are loaded, but it is not immediately apparent where these components are loaded in the sandbox. A new CLI command displays the sandbox structure. The general syntax of the command is as follows:
scm show sandbox-structure -w <workspaceName> -C <componentName> <-json>
For details, see the CLI help (scm help show sandbox-structure). Example:
scm show sandbox-structure -w myWorkspace -C teamComponent
This command enables you to know the exact location of the loaded projects in the sandbox. The output of the command shows the sandbox location, local path, and remote path of a project in the file system. A sample output for a sandbox loaded with two projects, proj1 (loaded from workspace ws1, component comp1 in root directory sb) and proj2 (loaded from workspace ws2, component comp2 in nested directory child), will look as follows:
>lscm show sandbox-structure
Sandbox: C:\cli\sb
  Local: C:\cli\sb\proj1
    Remote: ws1/comp1/proj1/
  Local: C:\cli\sb\root\parent\child\proj2
    Remote: ws2/comp2/proj2/
Jazz build
Dynamic load rules support in Rational Team Concert plug-in for Jenkins
The Rational Team Concert plug-in for Jenkins now includes support for dynamically providing load rules when loading sources from a build definition or workspace. The capability is exposed through an extension point in the Rational Team Concert plug-in for Jenkins. For more information, see the wiki on dynamic load rules support.
Personal build filters
The Builds view has an option to display only the personal builds that the current user requests.

Enterprise platform extensions
Dependency build and promotion
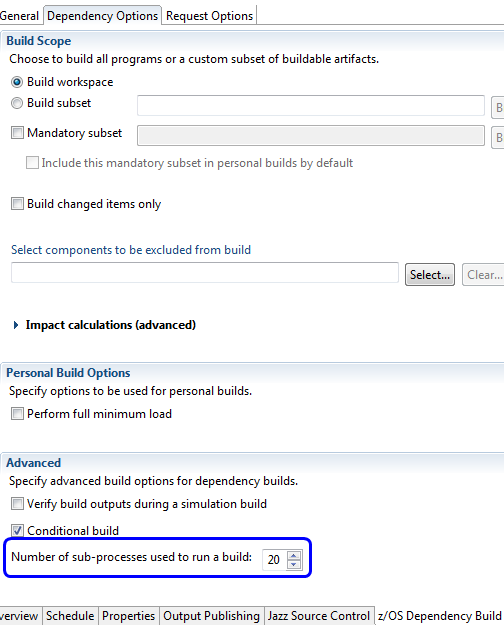
Multiple process builds
z/OS dependency builds now support using multiple processes for compilation activities. You can select the number of processes in the build definition editor on the Dependency Options tab of the z/OS Dependency Build page.
Further detail on reason for full analysis
The build log for a dependency build now contains further information if preprocessing runs a full analysis instead of a change set analysis. The log information can help identify the changes and configuration conditions that caused that analysis type to be executed.
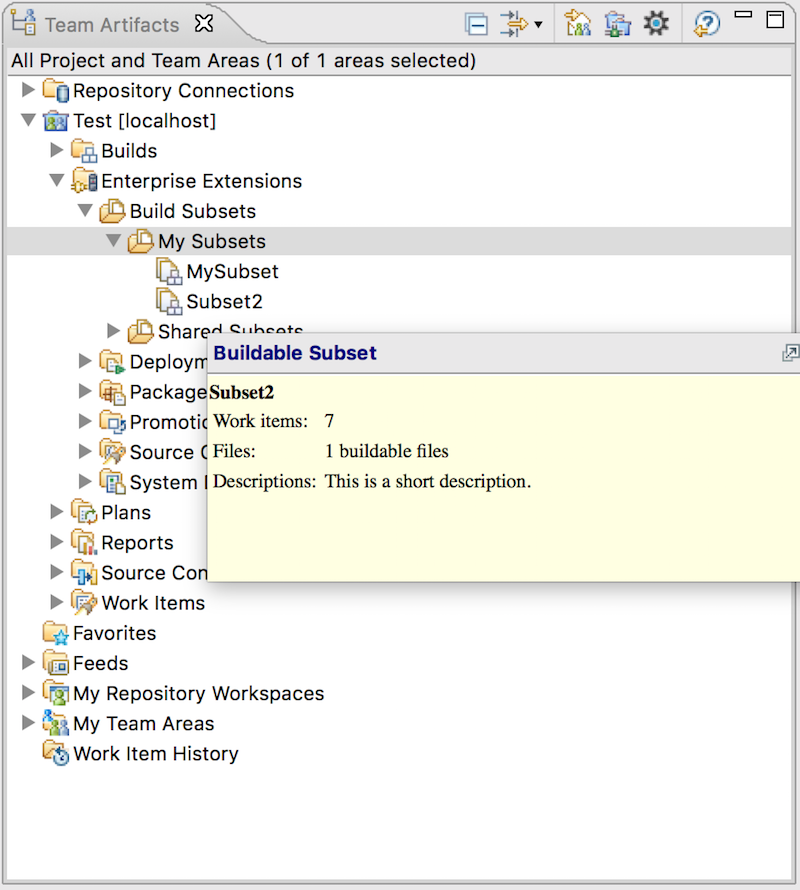
Tooltip information for buildable subsets
When you hover over a subset in the Rational Team Concert Eclipse client, a tooltip displays associated work items, the number of buildable files, and a description.
Changes to retrieve file details
The Open Local File and Open Remote File selections are available from the context menu of the Source Locationcolumn in the Files from the build machine produced by other builds table when the value of the column is not empty.

Build log publishing
Log publishing batch size
The performance of log publishing during z/OS builds is substantially improved. The connection to the repository is reused, which reduces overhead, and logs are published to the build result in batches. You can configure the batch size on the Output Publishing tab of the build definition editor. The default batch size is 10.

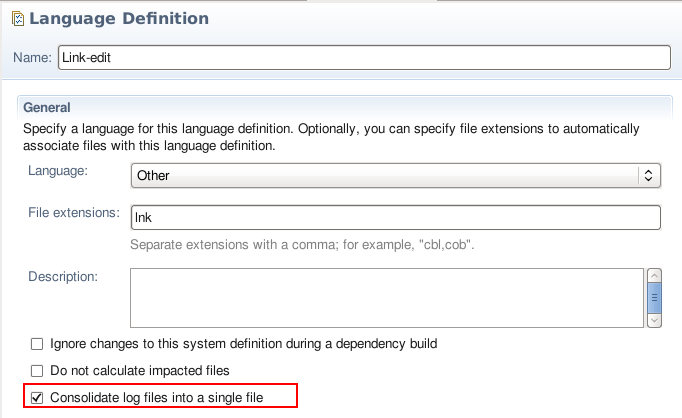
Consolidating log files
The Language Definition editor now contains an option to consolidate all published log files for a source member into a single file.
Compacting log files
You can now choose to compact log files produced during z/OS builds. When log files reside in a physical PDS they are compressed to save space. When they are uploaded to a build result, trailing whitespace is removed. Compacted log files in the PDS can be uncompressed in TSO using BLZCMD.
In the Data Set Definition editor, you can provide a default value for the compact setting, which is used when the DD has its Compact option set to Inherited.

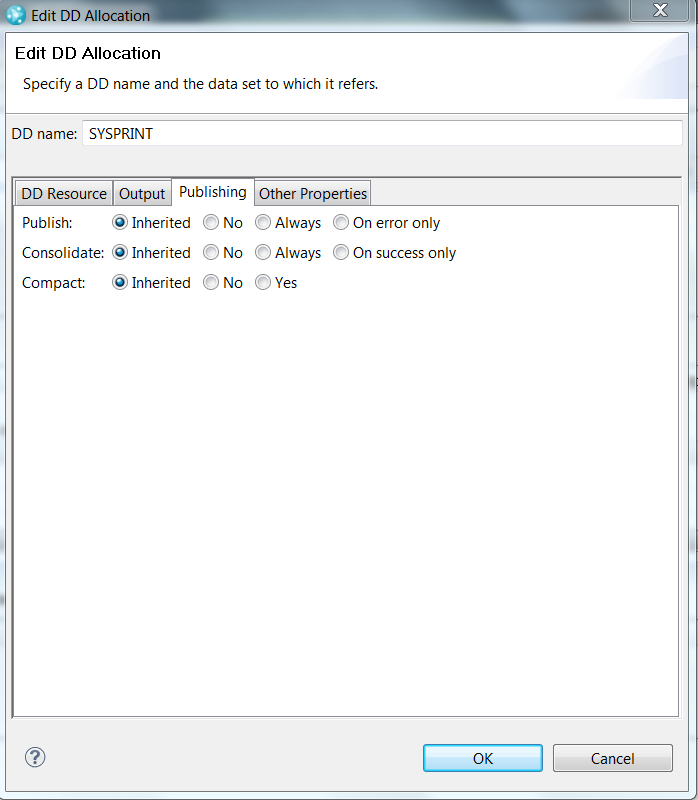
DD allocation publishing options
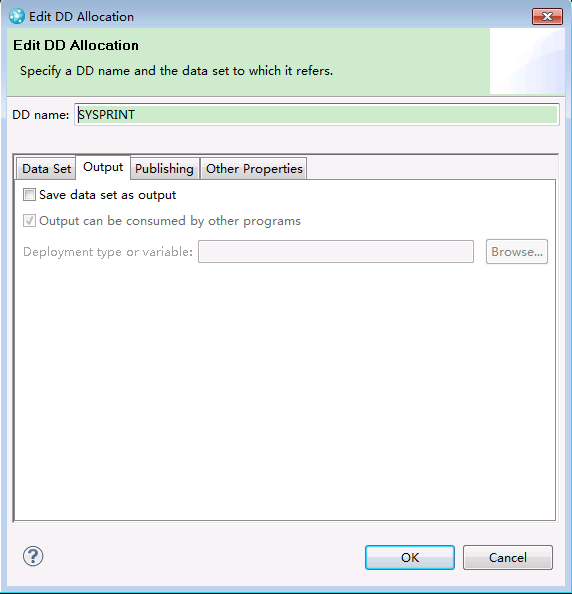
Log publishing options can be overridden for individual DD allocations. You can change whether and under what circumstances an output is published, and whether and under what circumstances the published output creates a consolidated log file.
Publish Output setting:
- Inherited: Publish logs in both PDS and build result, according to the settings in the build definition.
- No: Publish logs in PDS only, for successful and failed builds. Logs are not published to the build result.
- Always: Publish logs in both PDS and build result, for successful and failed builds.
- On error only: Publish logs in both PDS and build result, when the build fails.
The publish output setting in the Edit DD Allocation dialog box has a higher priority than that in the build definition. For example, if Publish job output logs is not selected in the build definition, but Always is selected in a DD allocation dialog box, the related logs are still published into the build result according to the individual log publish setting. The Publish successful logs as zip files option in the build definition is now always available, even when Publish job output logs in the build definition is not selected.
Consolidate Output setting:
- Inherited: Use the consolidated log file setting from the language definition.
- No: An individual log file is always used for this DD, regardless of the language definition setting.
- Always: A consolidated log file is always used for this DD, regardless of the language definition setting.
- On success only: A consolidated log file is used for this DD when the translator step succeeds, otherwise an individual log file is used.
Compact setting:
- Inherited: Use the compact log file setting from the data set defintion.
- No: The log is left alone.
- Yes: The log file is compacted.
Build logs in the Build Map editor
When a DD has publishing enabled and it is using a new or existing data set definition, the PDS information is stored in the build map. This information is available on the Logs tab of the Build Map editor and, when integrated with Rational Developer for z Systems, its File Location value is a link that opens the remote member.

Source code data scanning
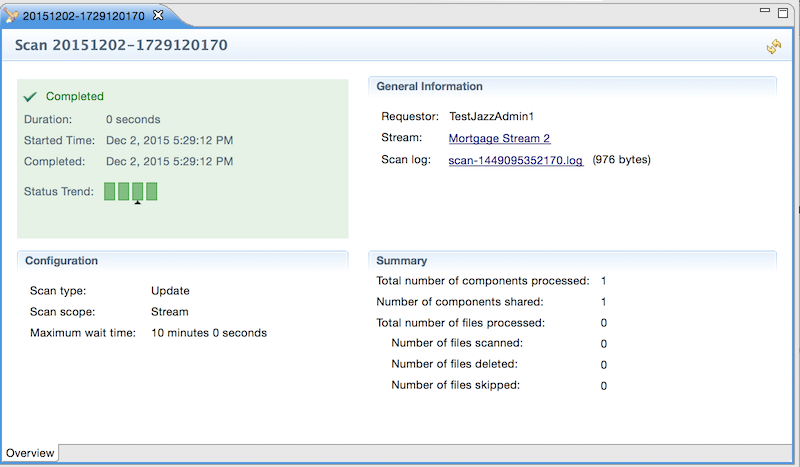
Show number of shared components in scan result
The scan result now shows the number of components shared during a Source Code Data scan.
System definitions
Support for custom Ant scripts in translators
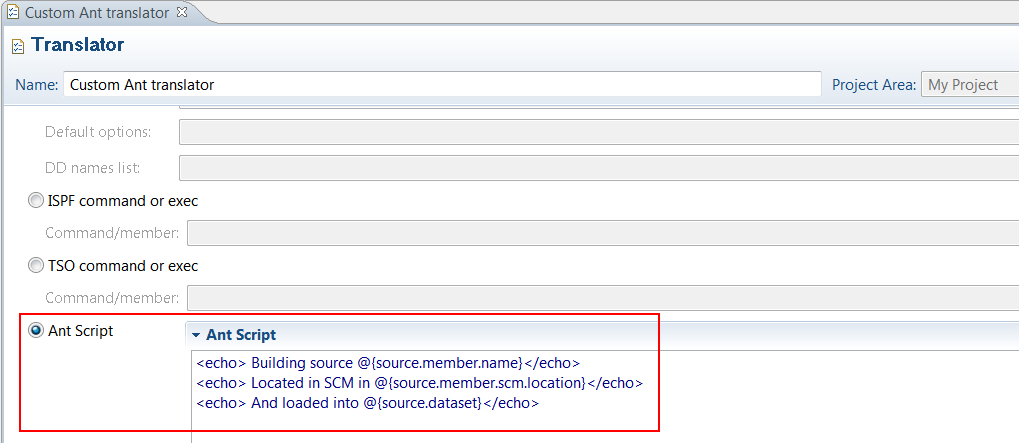
You can now define translators with a new type of call method: an Ant script. You can specify Ant syntax, which will run as part of the dependency build when the translator is invoked by a language definition. As part of the dependency build, these Ant scripts have access to the build context, including variables and properties.
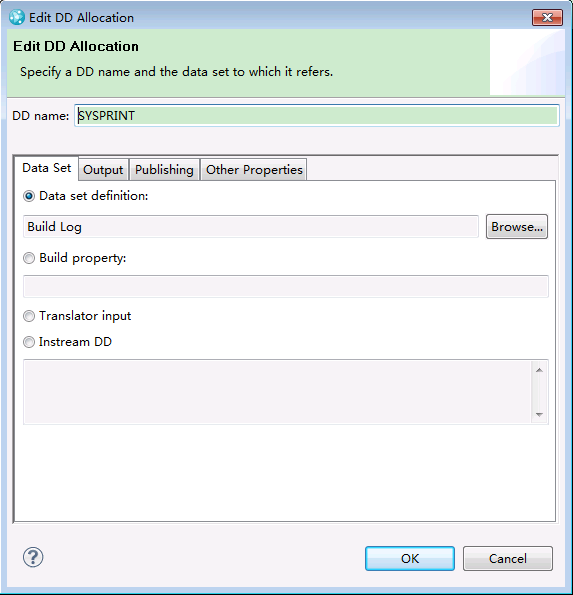
DD allocation dialog box
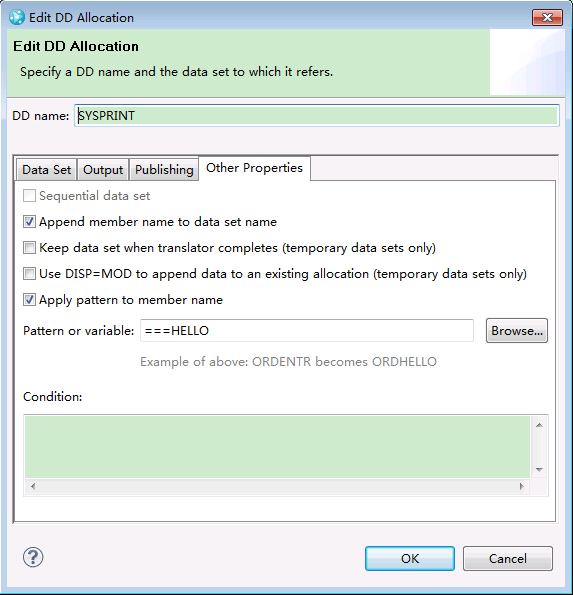
The DD Allocation dialog box in the translator editor is now organized into to four tabs: Data Set, Output, Publishing, and Other Properties.

Data Set Definitions now better supports system symbols
Validation in the Data Set Definition editor now allows 16-character system symbols, system symbols whose name contains an underscore or national characters, and substrings of system symbols.
Changes to member rename
When the data set for a DD allocation is a build property or a non-temporary data set definition, the Apply pattern to member name option is enabled on the Other Properties tab.


ISPF and TSO call methods
The ISPF and TSO call methods are grouped into a single option in the Translator editor. Publish, consolidation, and compacting options are available for the ISPF Gateway log file, similar to the publishing options for DDs.
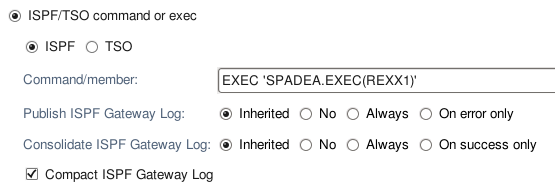
ISPF client
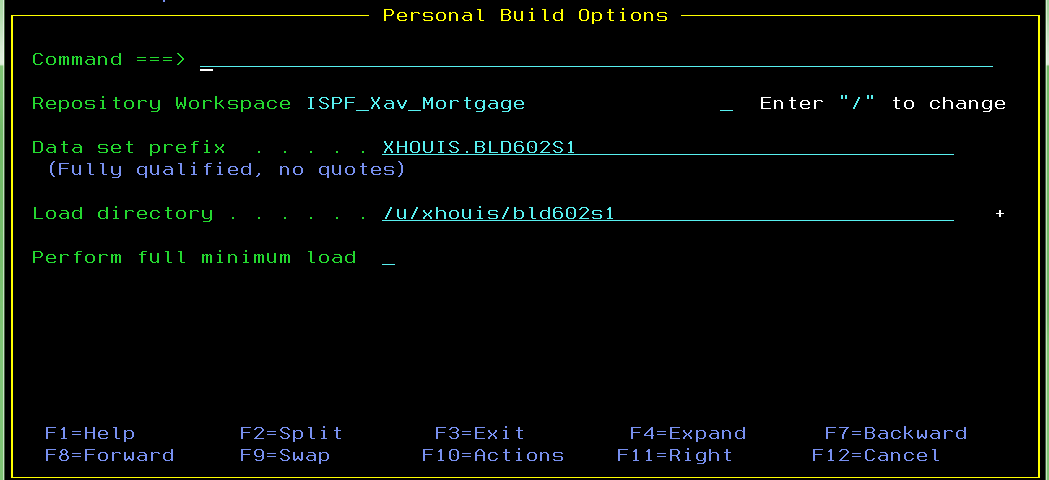
Personal build options kept for next request
The personal build options entered by the ISPF user (Repository workspace, Data set prefix, and Load directory) are kept and automatically redisplayed to the user on the next personal build request options panel.
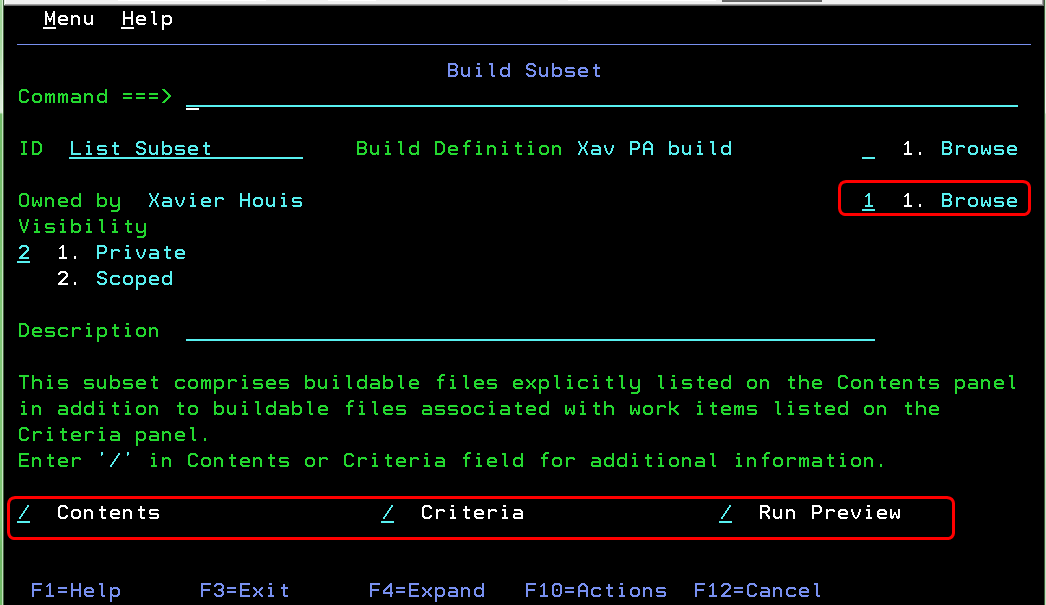
Build subset capabilities
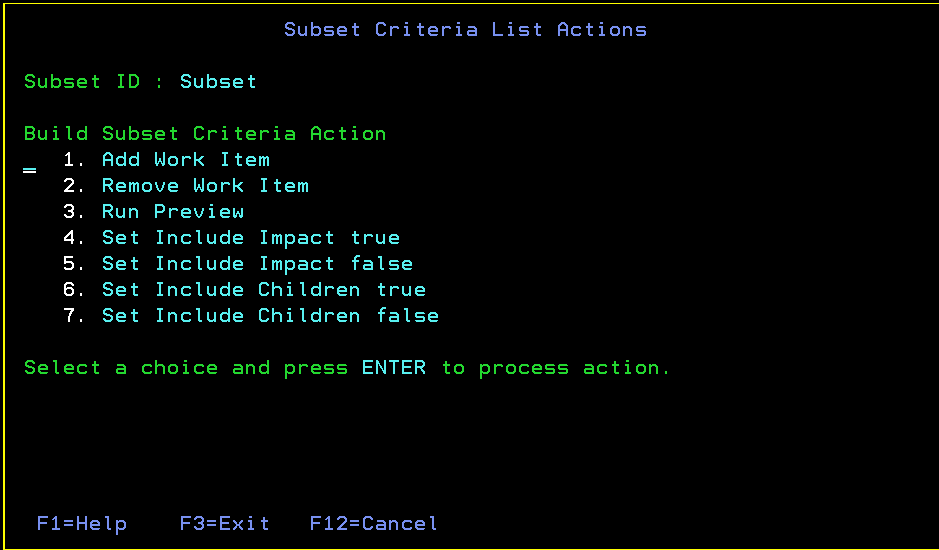
On the Edit Build Subset panel, which displays an overview of the subset, you can now modify the subset ownership by using the Browse field. You can also add or remove contents by using the Contents field, add or remove criteria by using the Criteria field, and request a preview of the subset that displays the buildable files in the subset by using the Run Preview field.
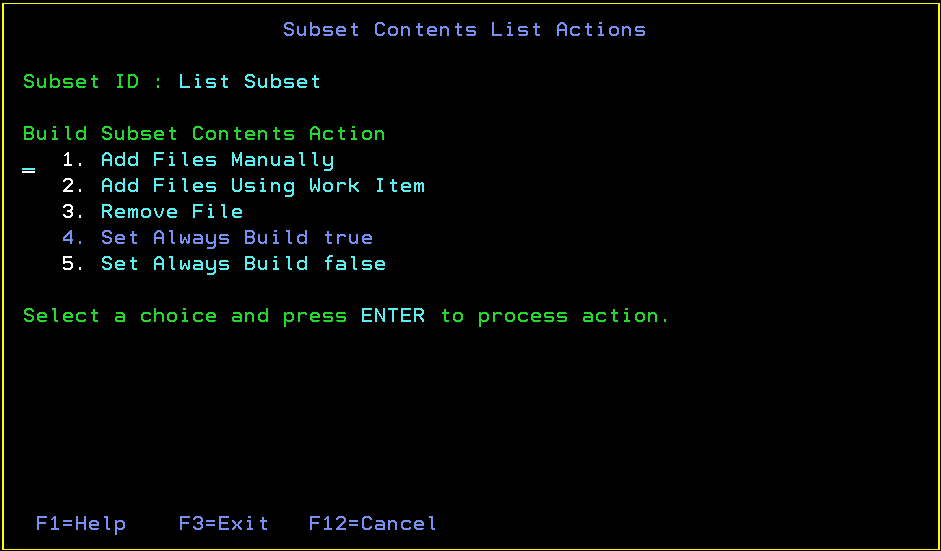
The Build Subset Contents panel displays a static list of buildable files that are rebuilt when you build the edited subset. You can add files, remove files, add files using a work item, and change the value of the Always Build field for each buildable file.

The Build Subset Criteria panel displays a list of work items containing buildable files that are rebuilt when you build the edited subset. You can add or remove work items, request a preview of a selected work item, and change the value of the Include Impact or Include Children fields for each work item criteria.

zload CLI subcommand
zload CLI subcommand loads an entire workspace or only items specified by a remote path
The zload CLI subcommand can now load either an entire workspace or a set of remote items by specifying a list of remote paths. The remote path can specify the name, alias, or UUID of a component, or a remote path within a component. To specify a remote path within a component, use the following format: <name, alias, or UUID of the component><remote path within the component>.
Load zFiles or zFolders directly to a dataset
The CLI zload subcommand can now load zFiles or zFolders specified by the remote-path option directly to a data set. The -d or --dataset option specifies the complete dataset name where the zFiles or zFolders will be loaded.
The specified dataset must exist before you run the zload subcommand.
Client for Microsoft Visual Studio IDE
Team artifacts filter
You can now filter the content of the Team Artifacts view based on the owning process areas. You can opt to see the content owned by your project or team areas, or customize the filter by selecting or unselecting some of the project or team areas. You can filter content under Source Control, Build Engines, Build Definitions, All Plans, and Team Area Shared (Queries).

Baseline history graph
You can now see a graphical diagram of the baseline histories of a component in a repository workspace or stream. This new view enables you to see how changes flow across release streams, see where baselines are used in different streams, and compare the contents of two streams or workspaces.

You can open this view by selecting a component of a stream or workspace in the Team Artifact View.

For details, see the Baseline history graph section.
File locking
When you lock a file, the system now prompts you if there are incoming changes to that file. You can continue with the locking operation or you can cancel it and manually accept incoming changes before retrying.
Stream and component locking
You can now lock streams and components to prevent deliveries. The actions to lock and unlock streams and components are available in the Team Artifacts view of the Eclipse and Visual Studio clients. For details, see the Stream and Component Locking section.
Switching histories in the History view
In the History view, you can now switch between the workspace history and stream/component history, and you can browse recently viewed history windows.

Pinning of Search view
You can now pin the search results in the Search view. Also, the view is reused for showing newer search results if not pinned.
Locking streams and components
Streams and components can now be locked from the Team Artifacts view. When a stream or component is locked, only the user that holds the lock can deliver changes.
Lock information in the Repository Browser view
You can now see lock information in the repository browser view. You can also lock or unlock a file from the same view.

Component hierarchies in the Pending Changes view
Component hierarchies are now shown in the Pending Changes view as well as the Team Artifacts view. The following image shows the Pending Changes view for a workspace with a component hierarchy.

You can set a preference to control whether the Pending Changes view shows components in a hierarchy or a flat list. The following image shows the preference in the Visual Studio client.

The preference is also available in the shell, as shown in the following image.

Workspace load
In the Load wizard, you can now select and define subfolders in the sandbox during load operations. With this feature, you can load multiple workspaces with common components into the same sandbox.

Rational Team Concert shell
Switching history in the History view
In the History view, you can now switch between the workspace history and stream/component history, and you can browse recently viewed history windows.
Locking streams and components
You can now lock streams and components from the Team Artifacts view. When a stream or component is locked, only the user that holds the lock can deliver changes.
Component hierarchies in the Pending Changes view
Component hierarchies are now shown in the Pending Changes view. You can set a preference in the Other Preference section of the control panel to control whether the Pending Changes view shows components in a hierarchy or a flat list.
(Source: What’s New In RTC 6.0.2)
Rational Jazz and Global Configuration Management
Component history
- You can view the history of a component by using the Show History action.
- Audit details show who made what changes when, and differences between attributes, links, and events.
- Collapse or expand the level of detail on the History page by using the segmented buttons at the top of the page.
- Show Ancestors focuses on the configurations that led to the selected one.
- Filters determine the type and number of artifacts shown in each column.
- Successor and predecessor navigation is available from the selected node.
Archive
- Configuration leads can archive global configurations and global components. Use the new Archived check box on the Attributes tab of the Configurations or Components pages to archive. When a component is archived, all configurations of that component are also archived. After a configuration or component is archived, it does not appear in search or query results, cannot be edited, and is displayed only when referenced by an active configuration.
- Unarchiving an archived component brings the component back to an active state, and restores the configurations that were archived with it.
- An Archived Artifacts search scope was added to Quick Search and to the Welcome page.
Tag and search
- The search functions in Browse Components and on the Welcome page now search tags and titles.
- The Name and Tags fields in the Add Configuration and Select Configuration Context dialog boxes are combined into a single search field.
- Quick Search has a More Options field, where you can add tags as part of the search criteria.
- The Browse Components page has a Tags column.
Custom component attributes and links
Configuration leads can now create custom attributes and links for global components, as they can for global configurations. The Manage Project Properties page supports the Global Configuration and Global Component artifact types. The Components page shows Attributes and Links tabs, which replace the Overview tab.
Rational Report Builder (formerly Jazz Reporting Service)
Report Builder
Report Builder is a key component of the Jazz Reporting Service, which you can use to quickly and easily consolidate data from across your tools and project areas. Depending on the applications that you use, and the type of information that you want to report on, you can choose to report on data that is collected in a data warehouse or that is indexed by Lifecycle Query Engine (LQE).
You can use the ready-to-use and ready-to-copy reports to quickly generate and share information about your projects, or you can create new reports. Your reports can show trends in project or team progress and quality throughout a release, sprint, or a specific time range. Traceability reports can show how artifacts are linked across lifecycle tools. If you use the configuration management features in the RM and QM applications, you can use Report Builder and Lifecycle Query Engine (LQE) to report on data in the configurations. You can export the report data in different formats, including Microsoft Excel spreadsheets or a template that you can use with Rational Publishing Engine to generate document-style reports. You can also export graphs as images for use in documents.
With Report Builder, it is easy to set up reports and integrate them with the CLM dashboards through the widget catalog. The Report Builder widget catalog includes the ready-to-use reports that cut across testing, requirements management, and change management. You can also share reports that you create.
Report creation
General user interface enhancements
Selecting a data source when importing reports
When report administrators import a set of Report Builder reports from a different server, they can now select which data source to import to – the Data Warehouse or LQE (the Lifecycle Query Engine). If the reports are not compatible with the selected data source, an error is shown. This function is useful when a particular type of data source (like the data warehouse) has multiple data sources. By default LQE offers two data sources – one for regular projects and another for projects that use configurations.
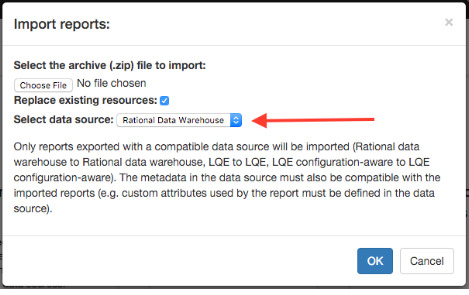
Duplicating a report while editing
When editing an existing report, you can now copy the report contents into a separate report in the same way as when viewing a report or starting it from the Use page. If it’s already been saved, you’ll see a Duplicate button beside the Savebutton in the upper right.

Learn page
Report Builder now has a central hub for documentation, articles, and videos about the Jazz Reporting Service. Click the new Learn button on the left sidebar to see useful links in common areas of concern. The page also provides quick links into Jazz.net for the forum and other library articles. It’s a quick way to get started learning about the product.

Report creation (all data sources)
Creating “My” reports for the logged-in user
You can now add a condition to user-based fields (owner, creator, and others) and specify that it should apply to the current user. When adding a condition to a user field, use the new Current User radio button. Then, when the report is shown on the dashboard, the user who is logged in is used for the condition. The result is that you can now create reports such as “My Open Defects” that show different results, depending on who is viewing the report.
Adding your own axis labels for graphs
When creating a graph visualization, you might want to change the description of the X and Y axis to clarify what the data means. You can now use the graph configuration pane of the Format Results tab. Enter your text beside the X and Y axis selections to create your own headings for each axis.
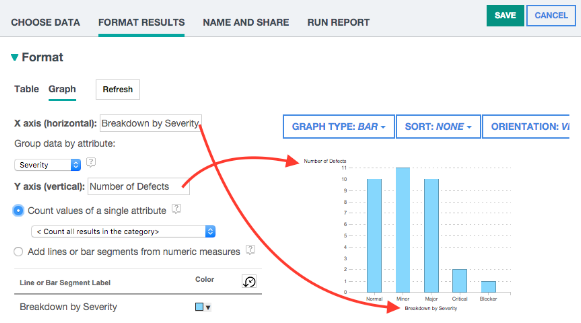
Reporting on timesheet information for work items
You can easily create timesheet reports by creating a traceability link from Work Item to Time Entry.
Then add conditions for Time Entry in the Conditions pane for a particular date range, day of the week, or month.

Tracing multiple relationships between the same source and target
Now you can report on multiple relationships between the same source and target. For instance if you want to report on all “Contributes to” and “Duplicate of” relationships and exclude other relationship, multi-select these relationships to create a traceability report. The only caveat is that the multiple relationships path is still not possible when the relationship is to different target artifacts.

Then the traceability path lists the relationships in the link between the source and the target, separated by commas.

Report creation (data warehouse data source)
Displaying current data in work item trend totals and burndown and burnup reports
Historical trend reports in the Report Builder are created from metrics data gathered by the data mart fact collection jobs in the Data Collection Component (DCC). These jobs are typically run once a day, usually overnight when server activity is low. When looking at trends for work item totals, the trends for the current day are based on the fact collection job that ran overnight. Consequently, data for the current day could be stale if many updates (creations, resolutions, and so on) were in the live repository since the total metrics was gathered.
Now, for all burn-down and burn-up ready-to-use reports and the Work Item Totals (live current data) historical trend, the results include the latest current data collected by DCC for the current day (from the operational data store, ODS). Although the data is not exactly live, it is current as of the last synchronization of the DCC ODS data collection jobs. For some deployments you can tune the synchronization to within the last 5 or 10 minutes.

You’ll see two totals in the list. The other trend, just Totals, behaves as before, and its data comes from the last overnight data mart job. Totals was retained so that you can migrate old reports manually and in case you need to keep all the trend data consistent at a given point in time. As well, the current data option might result in a small performance penalty, because it requires running an extra query to retrieve the latest metric information.
Including test environment information for test execution
When creating test execution records during a test cycle, a test lead assigns someone to create a set of test environments that represent supported deployment scenarios and then run the same test case against each of the test environments. For instance, you might require your web application to support the Firefox, Chrome, and Internet Explorer browsers. Each browser configuration could be represented by a different test environment. Now you can report on test execution records with conditions for the associated test environment. For example, you might want to create a report of all test results that were run against one or more of the supported browsers.

Then you can view the particular test environment attribute in the report in one of the columns.
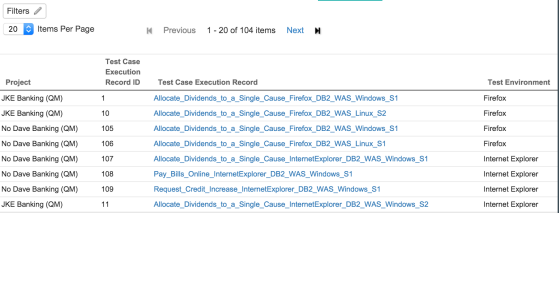
Reporting on requirement collections and modules
You can now report on requirement collections or modules and create a traceability path (such as Collection –> Requirement).

Using this capability, you can add conditions to a collection or module to isolate particular artifact types, such as a Use Case Specification.

Report creation (Lifecycle Query Engine data source)
External URIs for custom properties when using LQE
Report Builder now supports external URIs for custom properties in LQE-based reports. In tools such as Doors Next Generation (the RM application), users can specify an external URI for custom properties. Without an external URI, if DNG has multiple project areas, and an identical custom property is created in each project, the relationships list and the attribute list would display multiple copies of that property, each followed by the name of its project area. An LQE-based report using such custom properties is effectively limited to artifacts in the corresponding project area.
But with the same external URI specified in every DNG project for an equivalent custom property, Report Builder now shows a single property name. When you select that property, the resulting report includes artifacts from all of the projects.
Creating timesheet reports
Timesheet information is a core part of the Rational Team Concert informaton available for work items. Users can track the time they spend each day on each work item. Using the LQE data source you can now create a traceability report on time spent.
After selecting Work Item as the primary artifact, you can navigate to the Traceability links section and then pick Time entries.

This choice creates a traceability path from work items to time entries, and then you can add conditions or columns based on the attributes of the Time Entry field.

Creating work item approval reports
The LQE data source now supports creation of work item approval reports, similar to what you create using the data warehouse. Use the same Traceability links approach.

Using calculated columns in summary reports
The LQE data source now supports calculated columns, just like the Data Warehouse data source. Use the Format resultstab when creating your report.

By using calculated columns, you can create more complex reports that aggregate values based on a count of all artifacts in a group, and you can create a sum or average of numeric values.
Reporting on global configuration and components
You can now easily report on components and global configurations.
Performance improvements
Query caching has been improved. The set of projects a user has access to is now cached and updated when the data model is refreshed, every 12 hours or whenever a report manager explicitly refreshes the data source. Now you don’t need to run the query again to get the projects a user belongs to, which is a fundamental requirement to invoke access control at run time.
Also, some of the general query caching heuristics were improved to minimize having to re-run the query in multi-user scenarios. This should make common dashboards perform faster when different users with the same project access control are using the same dashboard.
Lifecycle Query Engine
Lifecycle Query Engine (LQE) implements a linked lifecycle data index over data provided by one or more lifecycle tools. A lifecycle tool makes its data available for indexing by exposing its data by using a tracked resource set, whose members MUST be retrievable resources with RDF representations, called index resources. An LQE index built from one or more tracked resource sets allows SPARQL queries to be run against the RDF dataset that aggregates the RDF graphs of the index resources. Thus, data from multiple lifecycle tools can be queried together, including cross-tool links between resources.
This release contains only quality improvements.
Data Collection Component
The CLM Java ETLs have been replaced with the Data Collection Component. Install and configure the Data Collection Component to report on data warehouse data. Designed to address key performance and deployment concerns with the current ETL solutions, Data Collection Component employs parallel processing and optimizes system resource utilization by using available system resources to process the data efficiently. Overall execution time for the ETL process for CLM data is reduced, whether there is a single instance or multiple instances to process.
- The ETL for DCC can now be extended. New ETL files can be dropped into the DCC mapping folder and loaded by using the new Load Jobs button on the Data Collection Jobs page. You can also delete jobs.
- The ETL files that are shipped with DCC are no longer located in the DCC mapping folder. Instead, they are bundled inside one of the server plugins. This has two advantages: the out-of-the-box ETL is better protected and the ETL files can be delivered as part of an iFix in a Patch Service compliant way.
- The initial DCC setup now schedules the out-of-the-box jobs to run automatically without user intervention. If the CLM server is using the Rational Insight Data Manager ETL, you must manually disable DCC jobs or uninstall DCC.
Adding custom ETLs
DCC now supports adding custom ETL (Extract, Transform and Load) files added to the mapping folder. Use them mainly to add custom metric tables and load extra information in the ODS (operational data store) tables. New tables or fields will only be accessible through Report Builder using advanced queries or through a customized Cognos Framework manager data model.
A new wiki page goes through the process of adding custom ETLs to DCC:
https://jazz.net/wiki/bin/view/Main/DataCollectionCustomizationUsingDCC
Using fact details jobs instead of history jobs
The History out-of-the-box DCC jobs are now called Fact Details. The new name avoids any misunderstanding of what those jobs do. The system issues a warning when those jobs are enabled. Additionally, you no longer see the Select Allbutton that enables all jobs, so you can’t inadvertently enable all jobs.
ALM Cognos Connector
ALM Cognos Connector enables a Jazz server to connect to an existing Cognos BI server already deployed in a WebSphere Application Server environment. This component provides the configuration for connecting the Jazz and Cognos BI servers. When it is configured, users can create and manage Cognos-based reports based on the artifacts from the Jazz server, similar to the capability provided by Rational Reporting for Development Intelligence in previous versions.
For more information on how to use the ALM Cognos Connector with a Cognos BI server and move existing reports to the new Cognos BI server refer to this topic: Migrating Rational Reporting for Development Intelligence reports to Cognos Business Intelligence using the ALM Cognos Connector
This release contains only quality improvements.

